

Data has changed the face of our world over the last ten years. The numerous emails, text messages we share, YouTube videos we watch are part of the nearly 2.5 quintillion bytes of data generated daily across the world.
Businesses, both large and small, deal with massive data volumes, and a lot depends on their ability to glean meaningful insights from them.
“Data analytics” is used to process this large amount of data by examining and interpreting large and complex data sets to uncover patterns, insights, and trends that can be used to inform business decisions. Data analytics involves various techniques such as data mining, predictive modeling, statistical analysis, and machine learning.
This blog serves as your ultimate guide to understanding what data analytics is all about and how Data Analysts convert and interpret huge amounts of data into meaningful ones for businesses all over the world. Also check out our blog on Data Science as well as Machine Learning for related topics.

What is the difference between Data Analysis and Data Analytics?
Before diving in, let's first clarify the differences and similarities between Data Analytics and Data Analysis since they are frequently used synonymously.
Data analytics is a general term for a field that includes the entire management of data and the methods and instruments employed. On the other hand, data analysis is the process of dissecting a given data set into its component pieces and analyzing each one separately, as well as how the parts relate to one another. Let’s take a look at their differences and similarities to better understand each of them:

Data analysts use both data analytics and data analysis in their work. Data analysis involves examining and interpreting data to draw conclusions or identify patterns, while data analytics involves using technology and statistical methods to analyze data and extract insights. As part of their role, data analysts utilize both techniques to make informed decisions and recommendations based on data.
What does a data analyst do?

A data analyst is a professional who collects, processes, and performs statistical analyses on data.
Their primary responsibility is to collect, organize, and interpret large and complex data sets using various data analytics tools and techniques. Data analysts use their skills to help organizations make data-driven decisions, identify trends, and solve business problems. They may also be responsible for creating reports and visualizations that communicate data insights to stakeholders.
- Providing insights: Data analysts can analyze data to identify trends, patterns, and insights that can help businesses make better decisions. They can use data visualization tools to present these insights in a way that is easy for non-technical people to understand.
- Improving performance: Data analysts can help businesses improve their performance by identifying areas where they can cut costs, increase efficiency, and optimize operations. By analyzing data, they can identify bottlenecks in workflows and suggest solutions to overcome them.
- Identifying customer behavior: Data analysts can analyze customer data to identify customer behavior, preferences, and trends. This information can be used to create more targeted marketing campaigns and improve customer satisfaction.
- Risk management: Data analysts can help businesses manage risk by analyzing data to identify potential problems before they occur. They can also identify patterns in customer behavior that may indicate fraudulent activity.
- Forecasting: Data analysts can use historical data to forecast future trends and outcomes. This information can be used to make informed business decisions and plan for the future.
Overall, data analysts play a critical role in helping businesses make better decisions, improve performance, and stay competitive in today's data-driven business environment.
A common confusion comes when hiring Data Analyst and is around the terms "data analyst," "data engineer," and "data scientist" since all three work with data analytics, but each of them have distinct roles and responsibilities. Let’s look at the differences between each of them so that you can pick and select the right hire for your organization:
What is the difference between Data Analyst, Data Engineer and Data Scientist?

- Data analysts are responsible for analyzing data to extract insights and make data-driven decisions. They often work with tools like SQL, Excel, and Tableau to analyze data, build reports, and create visualizations. They usually have a strong understanding of statistics and data modeling techniques.
- Data engineers are responsible for designing, building, and maintaining the infrastructure necessary for data analysis. They work with tools like Hadoop, Spark, and other big data technologies to collect, store, and manage data. They are skilled in programming languages such as Python, Java, and Scala.
- Data scientists are responsible for discovering insights and making predictions by analyzing large and complex datasets. They use statistical modeling and machine learning techniques to develop predictive models and algorithms. They have expertise in programming languages such as Python, R, and SQL, as well as knowledge of data visualization tools.
In summary, data analysts analyze data, data engineers build and maintain the infrastructure necessary for data analysis, and data scientists use statistical modeling and machine learning techniques to extract insights and make predictions.
For further reading, check out our blog posts on Data Scientists and Data Engineers.
What are the roles and responsibilities of a Data Analyst?
The role of a data analyst involves organizing data related to various behaviors, such as sales numbers, market research, logistics, and linguistics. They ensure data accuracy and quality by utilizing their technical expertise. The analyzed data is then designed and presented in a manner that assists individuals, businesses, and organizations to make better decisions.
Some of the key responsibilities of a data analyst include:
- Using automated tools to extract data from primary and secondary sources, removing corrupted data and fixing coding errors, developing and maintaining databases, performing data analysis to assess its quality and meaning, and using statistical tools to identify patterns and trends in complex data sets.
- Assign numerical values to important business functions, analyze local, national, and global trends that impact both the organization and the industry, and prepare reports for management stating trends, patterns, and predictions using relevant data. They also work with programmers, engineers, and management heads to identify process improvement opportunities, propose system modifications, and devise data governance strategies.
- Exploratory Data Analysis (EDA) is another critical aspect of a data analyst's job description. In EDA projects, data analysts scrutinize data to recognize and identify patterns, and then use data modeling techniques to summarize the overall features of data analysis. Finally, they prepare final analysis reports for stakeholders to understand the data-analysis steps, enabling them to make important decisions based on various facts and trends.
What skills do Data Analysts have? What tools and technologies do Data Analysts use?

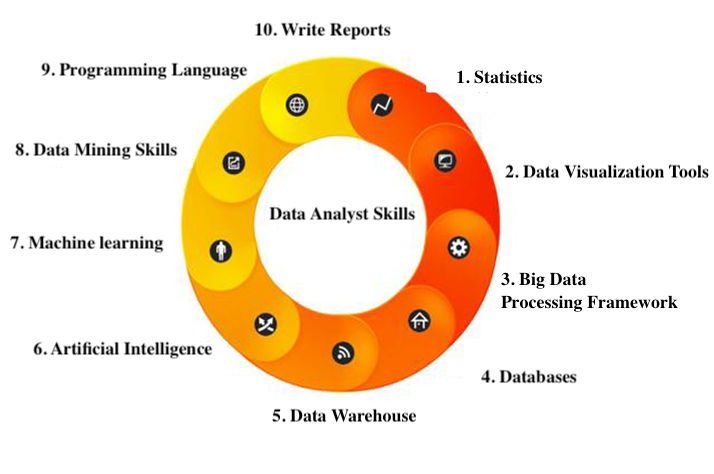
Some of the key skills required to be a proficient Data Analyst are:
- Strong mathematical skills for collecting, measuring, organizing, and analyzing data.
- Knowledge of programming languages like SQL, Oracle, R Programming, MATLAB, and Python.
- Technical proficiency in database design development, data models, data mining techniques, and segmentation.
- Experience with reporting packages such as Business Objects, programming (Javascript, XML, or ETL frameworks), and databases.
- Proficiency in statistics and statistical packages like Excel, SPSS, and SAS for analyzing data sets.
- Familiarity with data processing platforms like Hadoop and Apache Spark.
- Knowledge of data visualization software such as Tableau and Qlik.
- Ability to create and apply accurate algorithms to datasets to find solutions.
- Strong problem-solving skills.
- Attention to detail and accuracy.
- Proficiency in writing reports, making presentations, and working in a team.
- Good verbal and written communication skills.
- Proven working experience in data analysis.
To elaborate further, let’s look in detail at some of the most often used tools and technologies by Data Analysts as mentioned above:

- Python - Python is an object-oriented open-source programming language. It supports a range of libraries for data manipulation, data visualization, and data modeling.
- R Programming - R is an open-source programming language majorly used for numerical and statistical analysis. It provides a range of libraries for data analysis and visualization.
- Tableau - It is a simplified data visualization and analytics tool. This helps you create a variety of visualizations to present the data interactively, build reports, and dashboards to showcase insights and trends.
- Power BI - Power BI is a business intelligence tool that has an easy ‘drag and drop' functionality. It supports multiple data sources with features that visually appeal to data. Power BI supports features that help you ask questions to your data and get immediate insights.
- QlikView - QlikView offers interactive analytics with in-memory storage technology to analyze vast volumes of data and use data discoveries to support decision making. It provides social data discovery and interactive guided analytics. It can manipulate colossal data sets instantly with accuracy.
- Apache Spark - Apache Spark is an open-source data analytics engine that processes data in real-time and carries out sophisticated analytics using SQL queries and machine learning algorithms.
- SAS - SAS is a statistical analysis software that can help you perform analytics, visualize data, write SQL queries, perform statistical analysis, and build machine learning models to make future predictions.
- Jupyter Notebooks - Project Jupyter is a one-of-a-kind service dedicated to the development of open-source software, open standards, and interactive computing services. It is compatible with a wide range of programming languages. As an open-source online tool, Jupyter Notebook allows you to create and share documents that may contain live code, equations, graphics, and narrative prose. The notebook may be used for a variety of purposes, including data cleansing and transformation, machine learning, and more.
- SPSS and VBA - Analysts frequently require a statistical analysis programme such as SPSS in addition to the instruments listed above. SPSS is an excellent choice for freshly certified analysts (more on SPSS below). VBA - Visual Basic for Applications - may be required by more experienced data analysts. It is a programming language built exclusively for Excel and is frequently used in financial analysis. It is also Word and PowerPoint compatible. Matlab is another excellent tool for creating algorithms, building models, and analyzing data.
These skill sets accompanied by the knowledge of the different toolset and technologies mentioned above should narrow your search in finding relevant candidates for your organization.
What is the compensation range for Data Analysts?
The compensation range for Data Analysts can vary depending on factors such as the company, location, level of experience, and industry.
According to data from Glassdoor, the average Data Analyst in the US makes $77,845.
The average bonus for a Data Analyst is $3,653 which represents 5% of their salary, with 48% of people reporting that they receive a bonus each year. Data Analysts make the most in San Francisco at $99,920, averaging total compensation 28% greater than the US average. However, this can range from around $44,000 to $109,000 or more depending on the factors mentioned above. In addition to base salary, many companies offer additional compensation in the form of bonuses, stock options, and other benefits. Data Analysts with advanced skills and experience may also be able to negotiate higher salaries and additional perks such as flexible schedules or remote work options.
Is there a good Boolean search for finding Data Analysts?
A generic boolean search string for finding Data Analysts around terms looks like:
- -job -jobs -sample -examples, to exclude irrelevant results
- (intitle:resume OR intitle:cv) to discover candidates’ online resumes or CVs
- (“data analyst” OR “data architect”) to cover variations of the same job title
Here’s an example of a simple string to find resumes:
(intitle:resume OR intitle:cv) (“data administrator” OR “database analyst”) -job -jobs -sample -templates
With this search string, the words “resume” or “CV” have to appear in the page title. Adding variations of data analysts job roles provides a larger number of relevant results. And, excluding more terms will reduce false positives.
Let’s look at what a final Boolean search looks like using the following fields:
- Job title: (“Data Analyst” OR “Data Analytics” OR “Quantitative Analyst” OR “Quant Analyst”) AND (“Senior” OR “Lead” OR “Team Lead”)
- Sector: (“Healthcare” OR “Banking”)
- Risk Analytics: (“Risk modeling” OR “Risk Analytics” OR “Risk Advanced Analytics”)
- Tech Stack: Python
The Boolean search string that can be created using the the knowledge we have gained and the aforementioned fields, applicable to any job board, would resemble the following:
(“Data Scientist” OR “Data Science” OR “Quantitative Analyst” OR “Quant Analyst”) AND (“Senior” OR “Lead” OR “Team Lead”) AND (“Healthcare” OR Banking) AND (“Risk modeling” OR “Risk Analytics” OR “Risk Advanced Analytics”) AND Python
Similarly, some of the complete boolean strings to find different titles of Data Analysts are:
- Business Analyst - "(("business analyst" OR "business analysis" OR "business analytic" OR "business intelligence") AND (sql OR tableau OR "data analysis" OR marketing OR operations OR statistics OR python OR "microsoft excel" OR reporting OR "sales analysis"))"
- Data Analytics - ("Decision Analytics Associate" OR "Business Analyst" OR 'Business Consulting' OR "Business Analysis" OR "Logistic Regression' OR 'Requirement Gathering" OR "Business Analytics" OR "Data Science" OR "Data Analysis" OR "data analytics" OR "Predictive Analytics" OR "healthcare analytics" OR "Data analysis") AND Python AND (SQL OR R OR Scala OR SAS) AND (APAC OR EHR OR Claims OR Payer OR Provider) AND (healthcare OR clinical OR Pharma)
- Data Analyst with Spark - (Data Analyst OR data analysis) AND (data mining OR machine learning OR big data OR data science OR data scientist OR data warehouse OR data warehousing) AND (python OR sql OR r OR hadoop OR nosql OR ETL OR analytics OR statistics OR java OR mysql OR databases OR aws OR scala) AND Spark AND (HDFS OR Hadoop Distributed File System) AND MapReduce AND Airflow AND (DAX OR Data Analysis Expressions)
By using Boolean search as shown above in combination with other research methods, you can greatly increase your chances of finding the right data analyst for your project. Good luck with your recruiting!
About Rocket
Rocket pairs talented recruiters with advanced AI to help companies hit their hiring goals and knows technology recruiting inside out. Rocket is headquartered in the heart of Silicon Valley but has recruiters all over the US & Canada serving the needs of our growing client base across engineering, product management, data science and more through a variety of offerings and solutions.


